Power BI
Power BI is the core of most of my analytical output. I build executive-facing dashboards and Finance-grade paginated reports that turn raw operational and AI telemetry into clear, actionable decisions — not just charts. My work spans DAX data modeling, direct API integrations with ServiceNow and Microsoft Viva Insights, and report designs built specifically for senior leadership consumption. I treat Power BI as a storytelling tool as much as a technical one.
Work examples
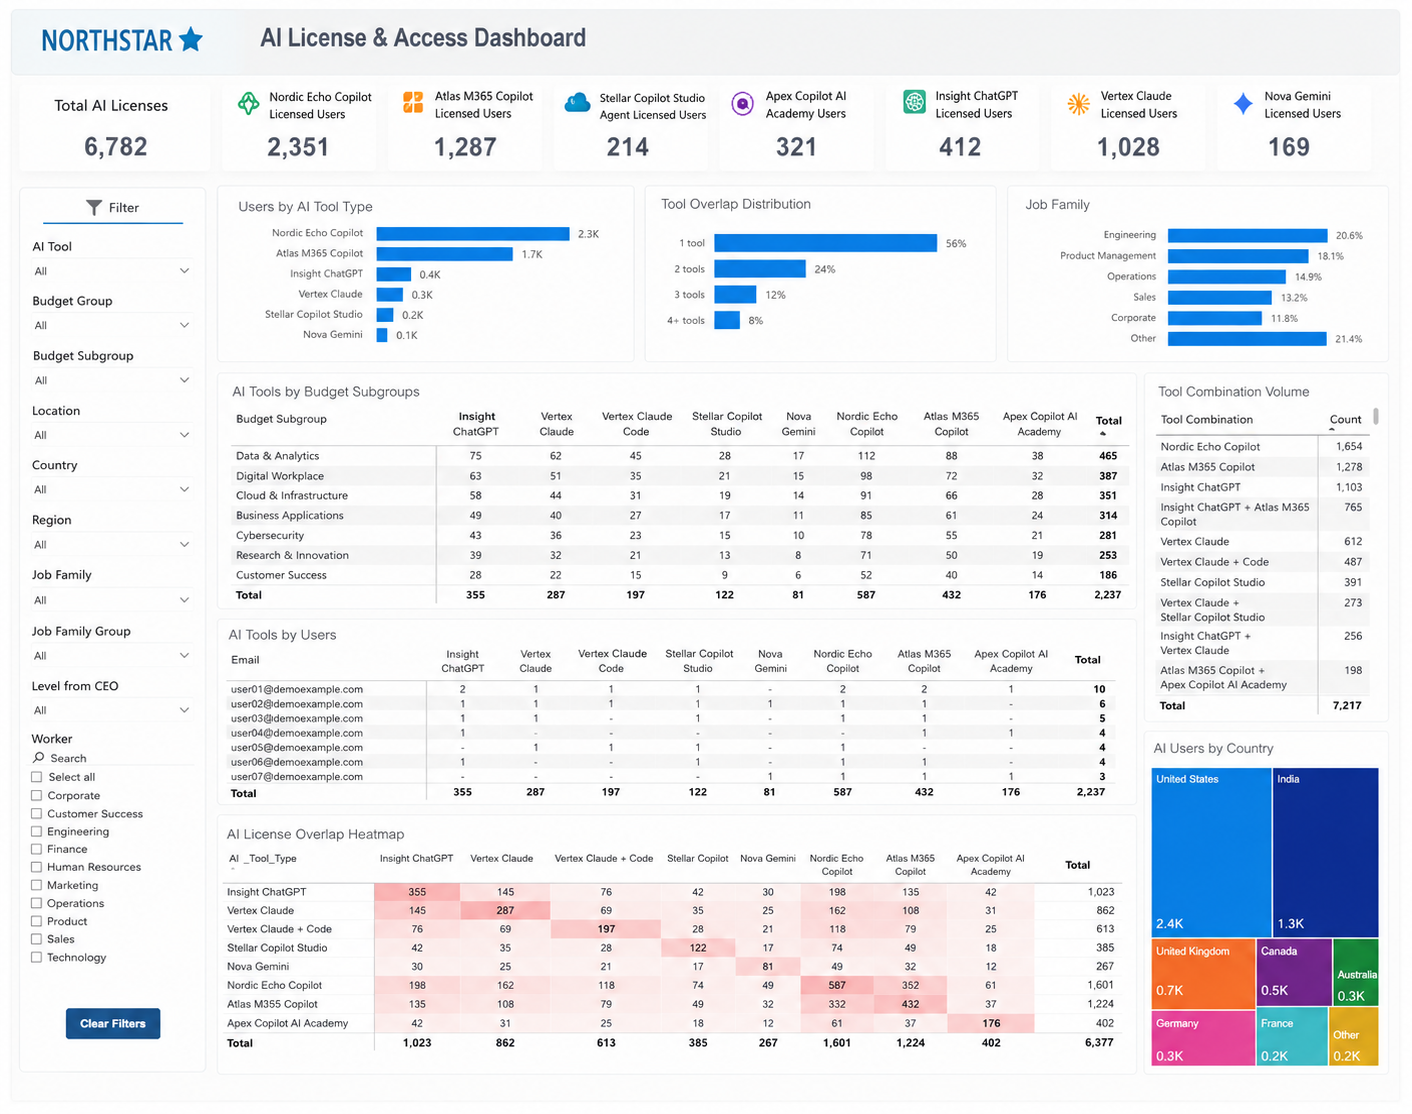
AI License & Access Dashboard
Tracks 6,700+ AI licenses across M365 Copilot, Copilot Studio, ChatGPT, Claude, and Gemini — with breakdowns by budget subgroup, job family, geography, and license overlap heatmap. Used by leadership to manage access and control spend.
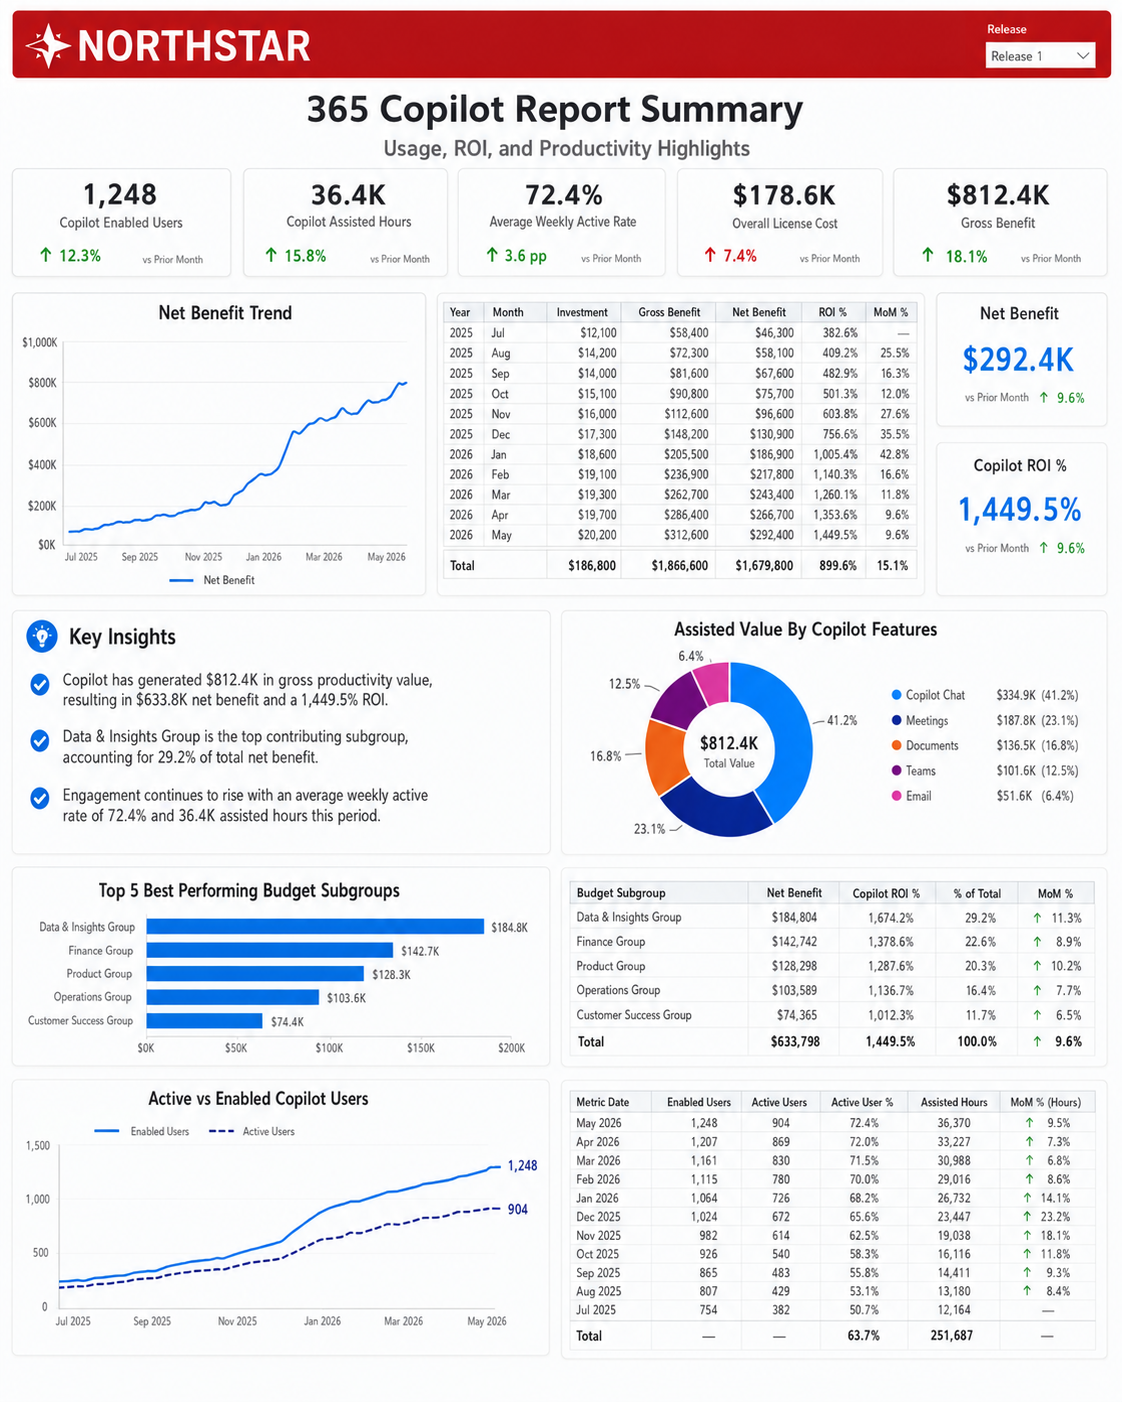
365 Copilot Report Summary
Tracks 1,248 Copilot-enabled users, 36.4K assisted hours, 72.4% weekly active rate, and $812.4K gross benefit — with ROI trend lines, feature-level value breakdown, and budget subgroup performance. Delivered to senior leadership monthly.
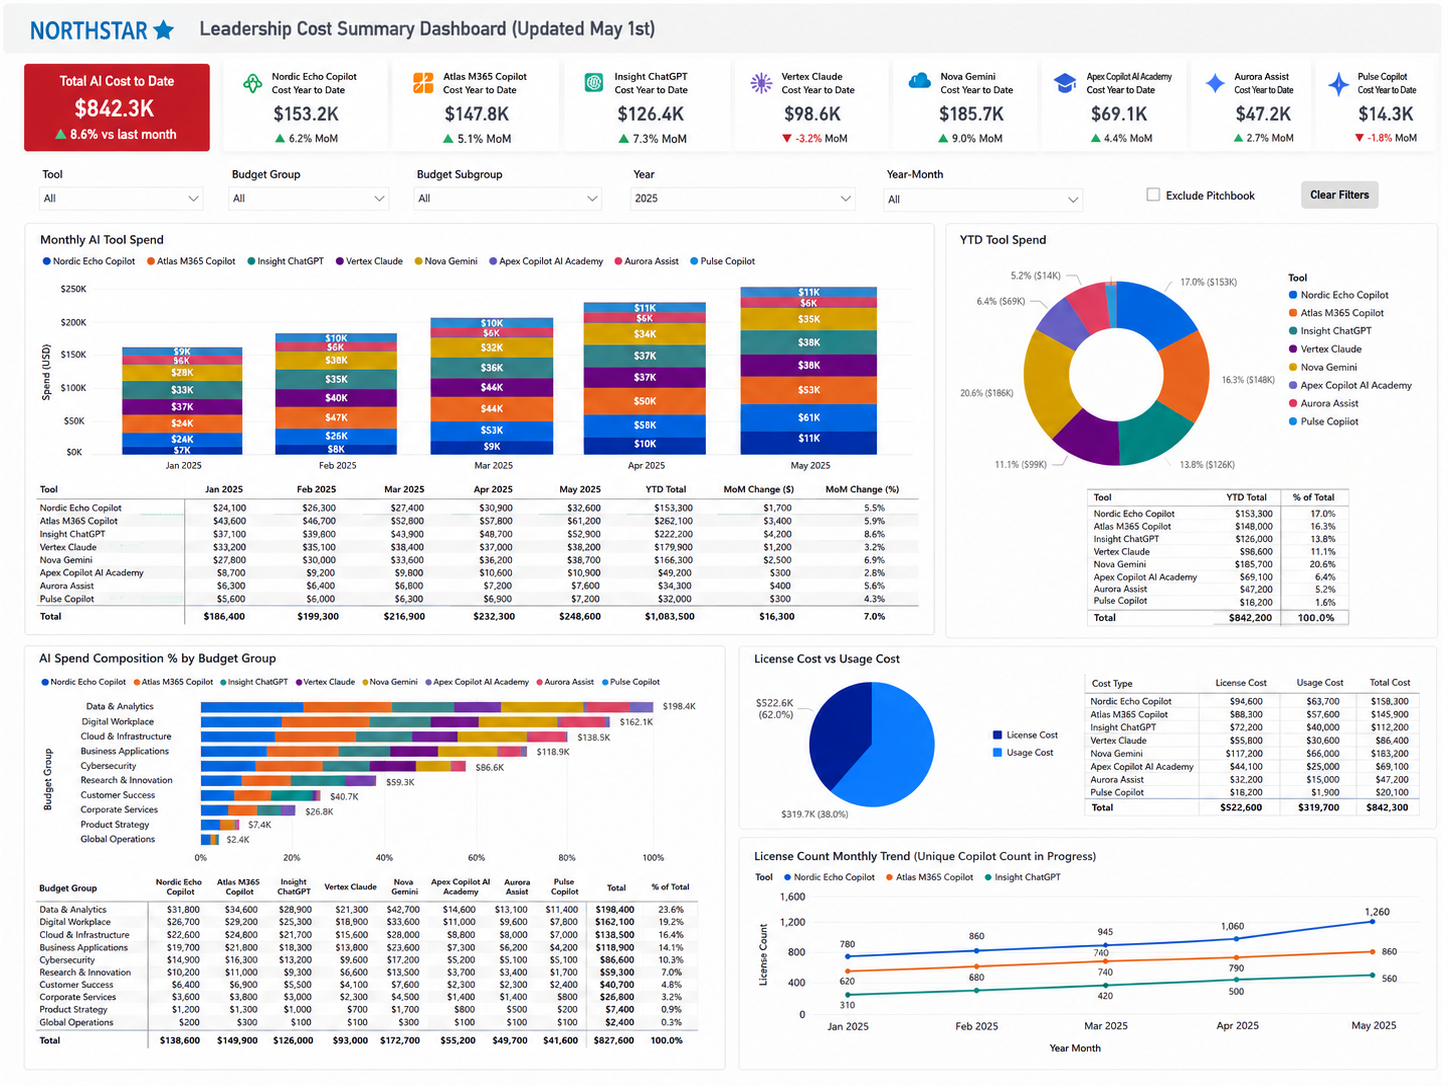
Leadership Cost Summary Dashboard
Tracks $842K+ in total AI spend across 8 tools by budget group, month-over-month trends, license vs. usage cost breakdown, and YTD totals — updated monthly for senior leadership.
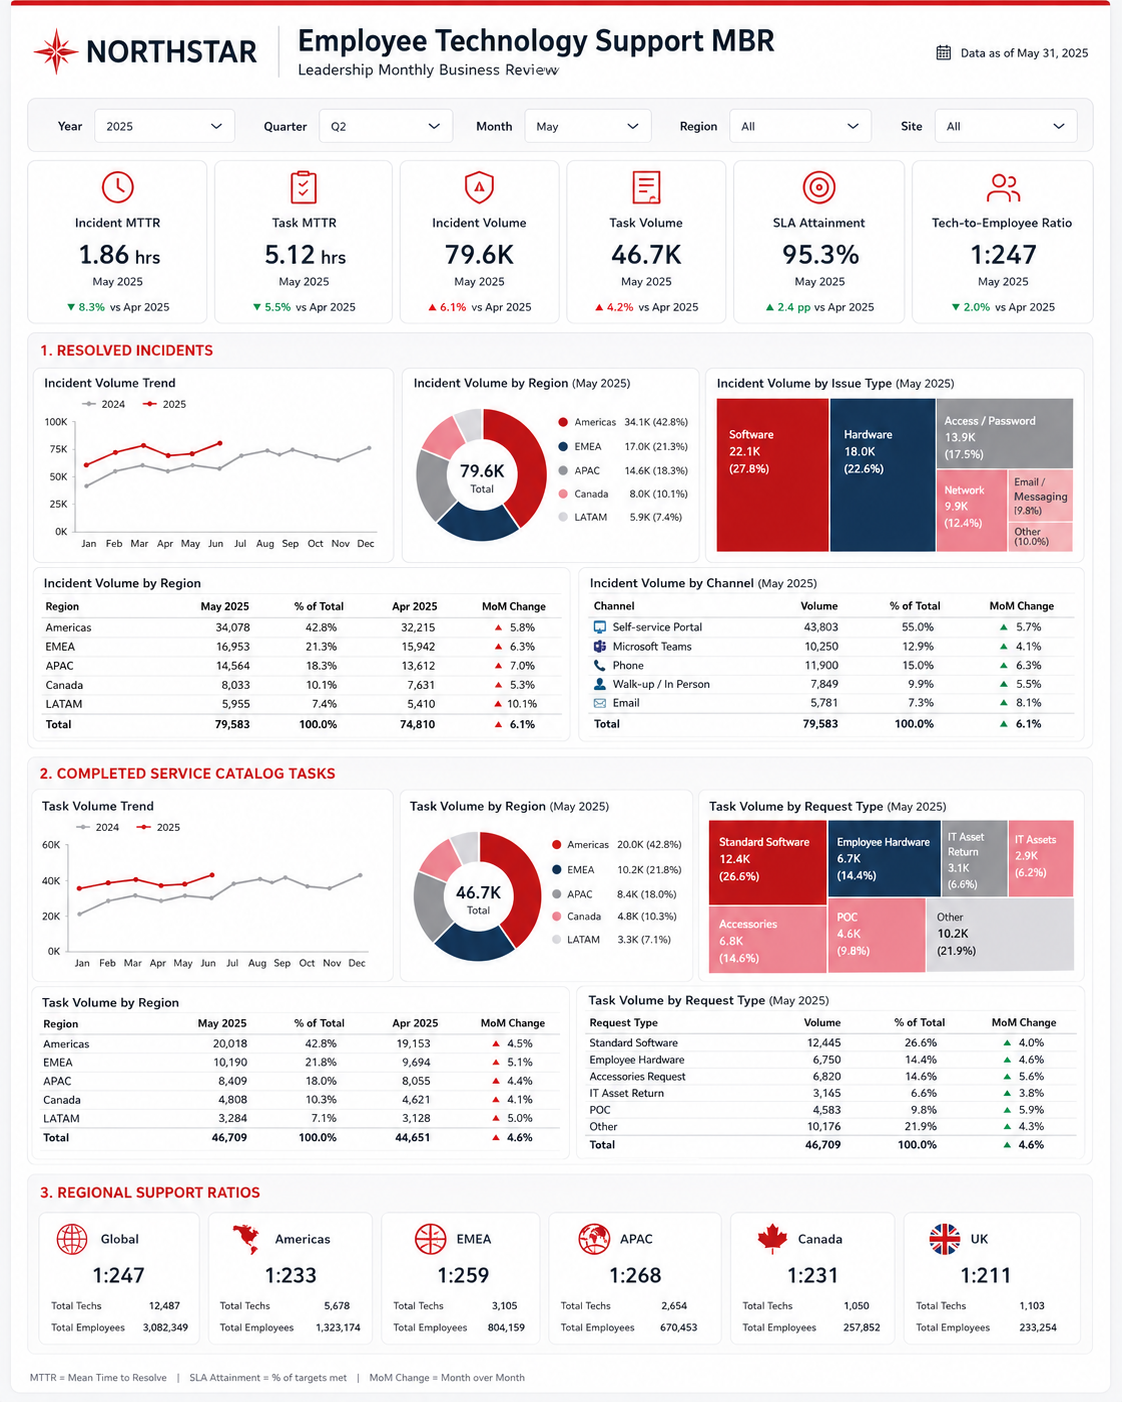
Employee Technology Support MBR
Leadership Monthly Business Review covering 79.6K incidents and 46.7K tasks — with MTTR (1.86 hrs), SLA attainment (95.3%), regional breakdowns, channel mix, and year-over-year trend lines across a global IT org.
Screenshots shown are placeholders. Built with synthetic data — original architecture, design, and analysis are my own work.