ServiceNow
ServiceNow is both a data source and an integration target in most of my operational work. I pull incident, task, asset, and escalation data from the ServiceNow API to power Power BI dashboards that give IT leadership real-time visibility into operations. On the other side, my Power Apps + Power Automate flows write back to ServiceNow — creating and routing tickets automatically based on checklist submissions, closing the loop between field reporting and formal ticketing.
Work examples
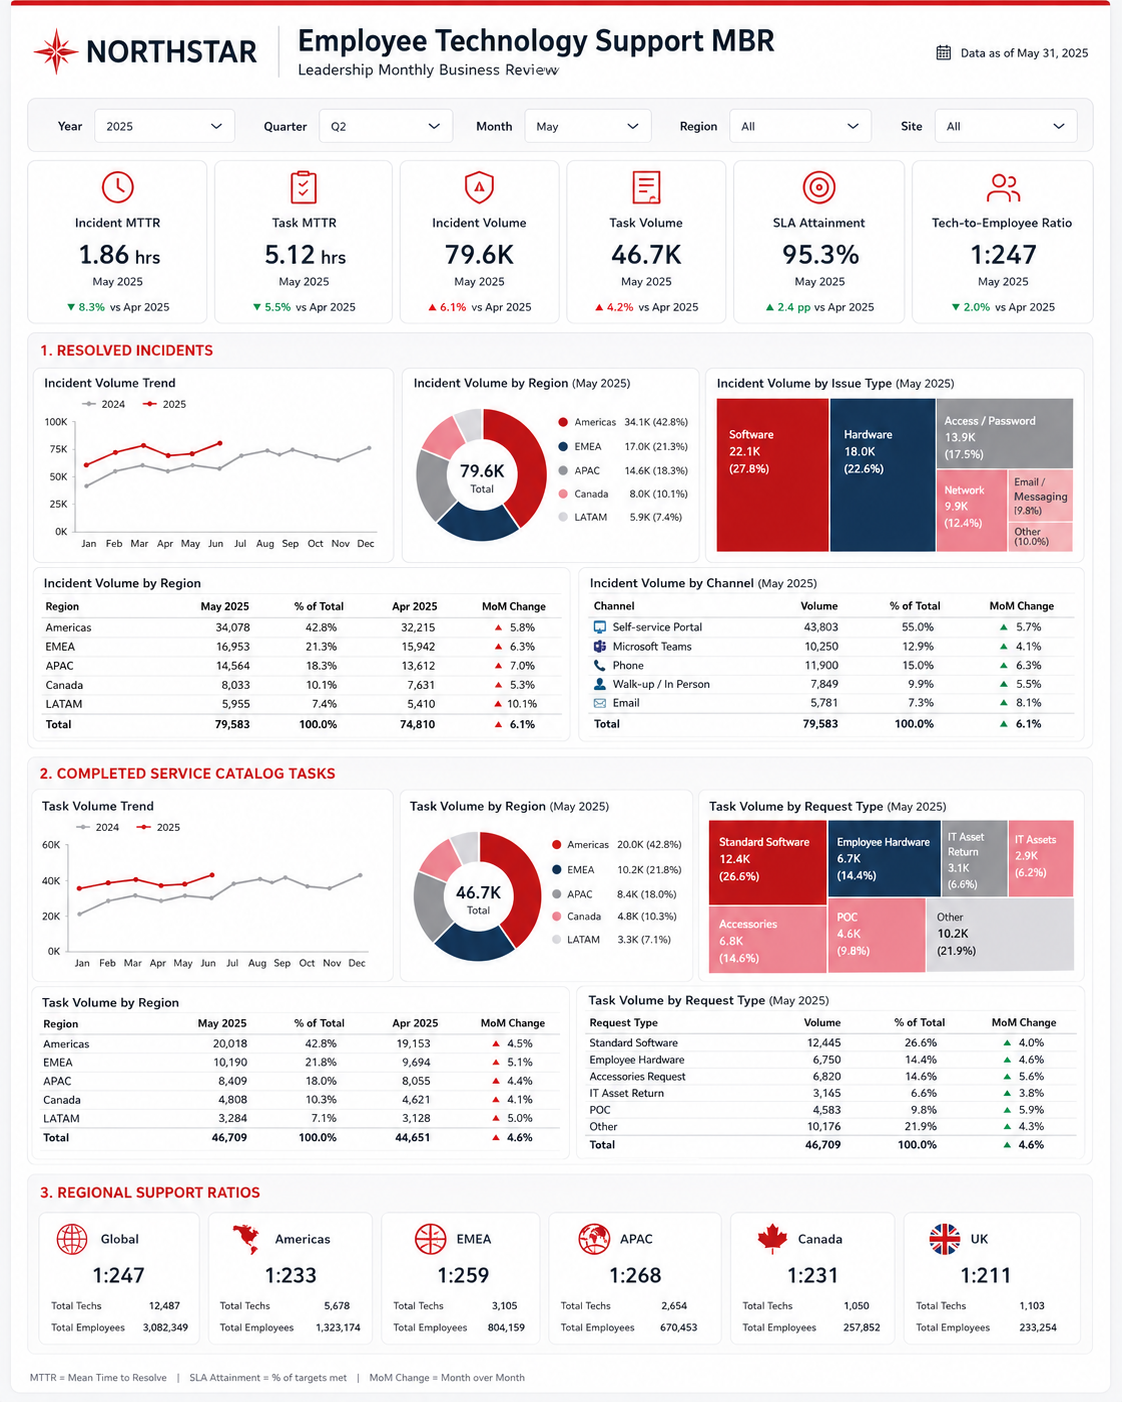
Employee Technology Support MBR
Monthly Business Review dashboard pulling live ServiceNow data — 79.6K incidents, 46.7K tasks, 1.86hr MTTR, 95.3% SLA attainment — broken down by region, channel, and request type for global IT leadership.
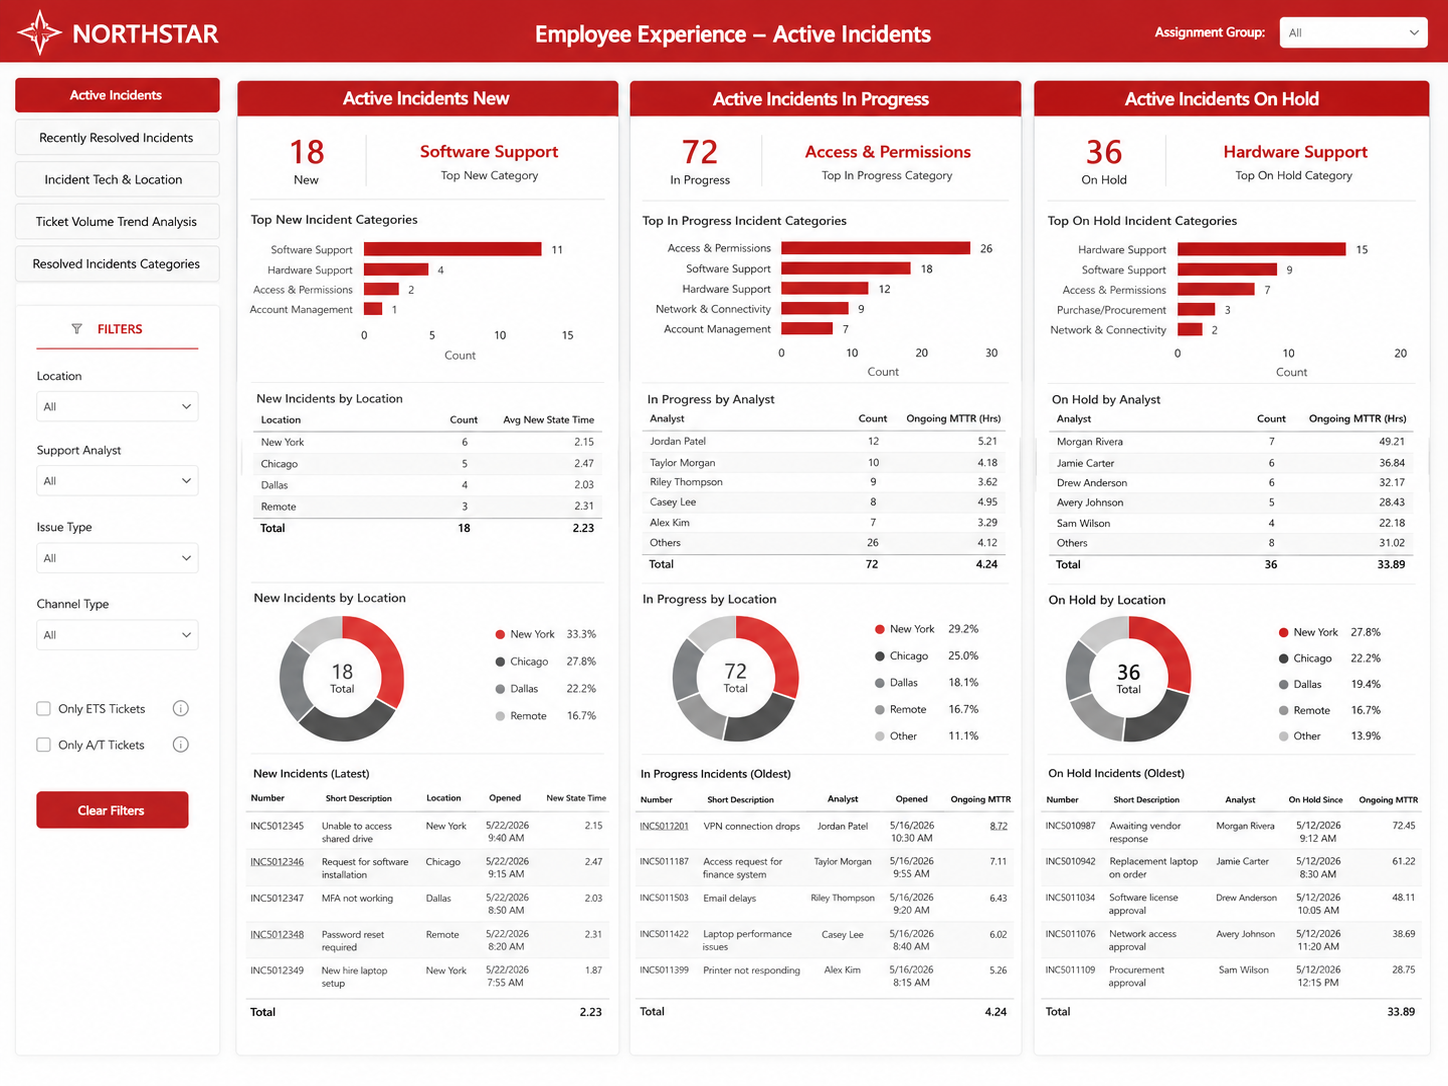
Employee Experience — Active Incidents
Real-time view of all open incidents split by status: 18 new, 72 in progress, 36 on hold — with category breakdowns, analyst workload, location distribution, and live ticket detail tables for immediate triage.
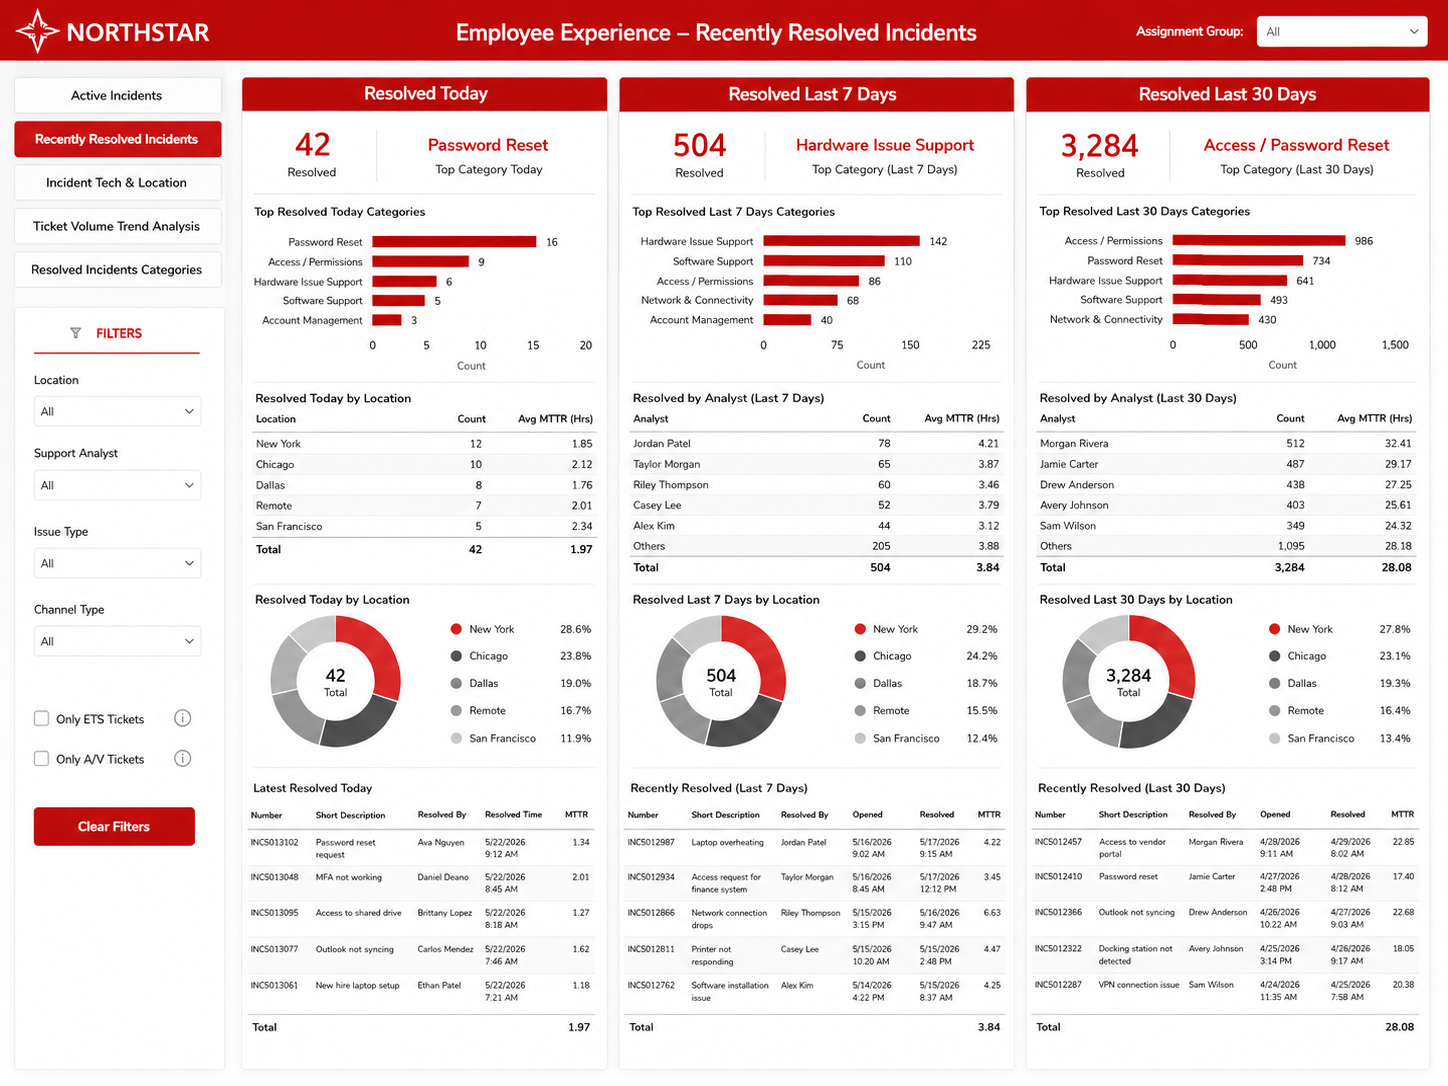
Employee Experience — Recently Resolved Incidents
Rolling resolution view across today (42), last 7 days (504), and last 30 days (3,284) — with top categories, analyst performance, location breakdown, and live resolved ticket detail at each time horizon.
Screenshots shown are placeholders. Built with synthetic data — original architecture, design, and analysis are my own work.